Monthly
Nonfarm Payroll Employment Forecasts
As noted here, real GDP did not decline until two quarters after the start of the recession which the National Bureau of Economic Research’s Business Cycle Dating Committee determined began in December 2007. Another key business cycle indicator watched by the BCD as it dates business cycle turning points, employment, started to decline right from the start of this recession, in January 2008. It is often said that employment is a lagging indicator (see, e.g., here and here), and the graph below shows that, for several post-World War II recessions, employment did not start to grow until after the business cycle trough was reached. But as noted above, the behavior of employment at the start of the late-2000s recession suggests a coincident indicator property of this time series.
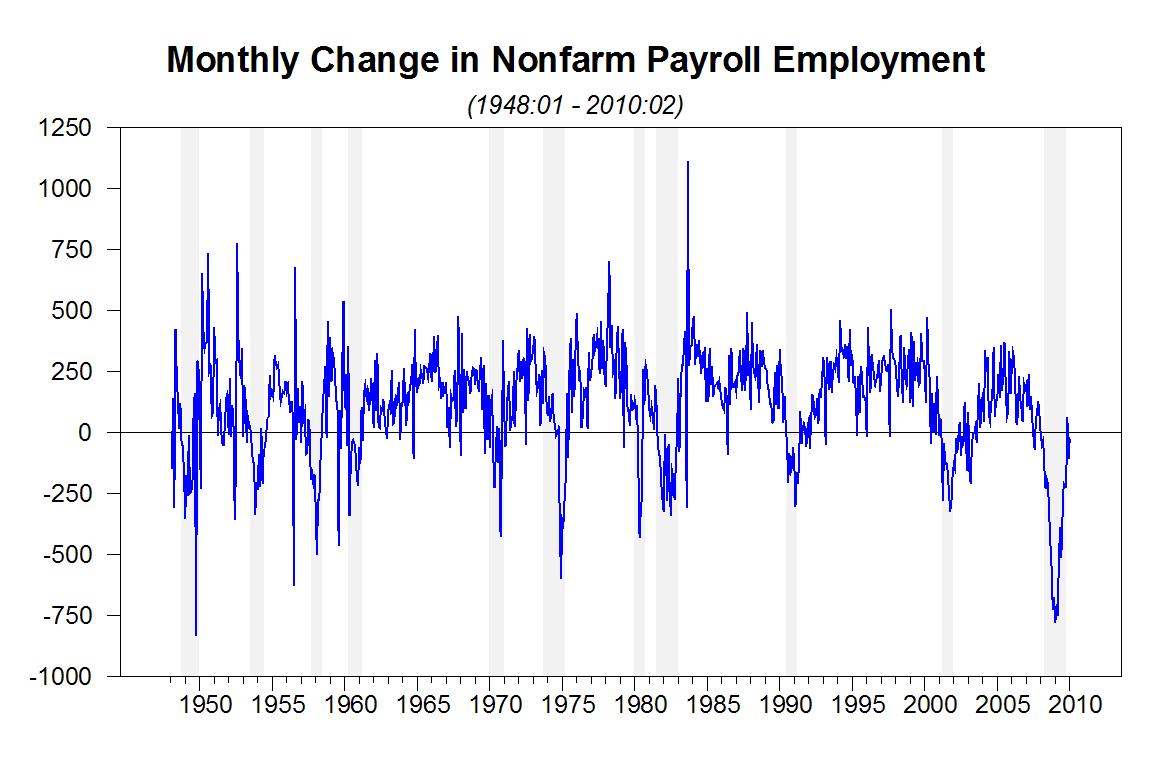
Measured on a
monthly basis, data on nonfarm payroll employment are prepared by the Current Employment Statistics (CES) program
of the Bureau of Labor Statistics at the U.S. Department of Labor through its established
(as opposed to household) survey. This list of Employment
Situation FAQs notes that the establishment survey: (1) has a smaller
margin error than the household survey (a month-to-month change of 107,000 is
the threshold for a statistically significant change in the establishment
survey at the 10% significance level, while it is 400,000 in the household
survey); but (2) has a less comprehensive scope than the household survey. As
explained in this CES Employment
Situation Summary, the initial employment data are revised over time as new
survey information is obtained and seasonal factors are recomputed. Starting
with April 2009, I will provide 1-month-ahead forecasts of this important
business cycle measure. Some details on how the forecasts were produced appear here.
1-Step-Ahead Forecasts for Change in (Seasonally Adjusted)
Monthly Nonfarm Payroll Employment:
[Change
from Previous Month]
|
Month |
Release Date of Initial Data |
Forecast |
Initial Data |
1-Month Revised
Data |
2-Month Revised
Data |
Benchmark Annual Revision |
|
May 2010 |
June 4, 2010 |
254,000 |
431,00015 |
|
|
|
|
April 2010 |
May 7, 2010 |
159,000 |
290,00014 |
|
|
|
|
March 2010 |
April 2, 2010 |
78,00012 |
162,00013 |
230,000 |
|
|
|
February 2010 |
March 5, 2010 |
-38,000 |
-36,00011 |
-14,000 |
39,000 |
|
|
January 2010 |
February 5, 2010 |
-36,000 |
-20,00010 |
-26,000 |
14,000 |
|
|
December 2009 |
January 8, 2010 |
-32,000 |
-85,0009 |
-150,000 |
-109,000 |
|
|
November 2009 |
December 4, 2009 |
-131,000 |
-11,0008 |
4,000 |
64,000 |
64,000 |
|
October 2009 |
November 6, 2009 |
-139,000 |
-190,0007 |
-111,000 |
-127,000 |
-224,000 |
|
September 2009 |
October 2, 2009 |
-177,000 |
-263,0006 |
-219,000 |
-139,000 |
-225,000 |
|
August 2009 |
September 4, 2009 |
-277,000 |
-216,0005 |
-201,000 |
-154,000 |
-211,000 |
|
July 2009 |
August 7, 2009 |
-350,000 |
-247,0004 |
-276,000 |
-304,000 |
-344,000 |
|
June 2009 |
July 2, 2009 |
-388,000 |
-467,0003 |
-443,000 |
-463,000 |
-504,000 |
|
May 2009 |
June 5, 2009 |
-541,000 |
-345,0002 |
-322,000 |
-303,000 |
-347,000 |
|
April 2009 |
May 8, 2009 |
-634,000 |
-539,0001 |
-504,000 |
-519,000 |
-582,000 |
|
March 2009 |
April 3, 2009 |
-- |
-663,000 |
-699,000 |
-652,000 |
-753,000 |
Last updated: June 23, 2010. Link to: BCI Forecast Page