As
of 3/1/11, this page is no longer being maintained. Please see: BCI Forecast Page
Quarterly
Real GDP Forecasts
On
December 1, 2008, the National Bureau of
Economic Research issued a release
announcing that its Business
Cycle Dating Committee (BCD) had determined a peak in U.S. economic
activity occurred in December 2007. Real GDP did not start to decline, however,
until the third quarter of 2008. This ‘lag’ in the peaking of GDP
was a key factor in the BCD’s decision
to wait as long as it did to formally determine the start of the most
recent recession. Indeed, roughly seven months before the BCD’s 12/11/08
announcement, Robert Hall, the
chair of the BCD, said
“it seems unlikely that we would ever declare a peak date when real GDP
continued to rise”; ex-post, this was exactly what the BCD did. This
lagging behavior in GDP relative to the start of the late-2000s
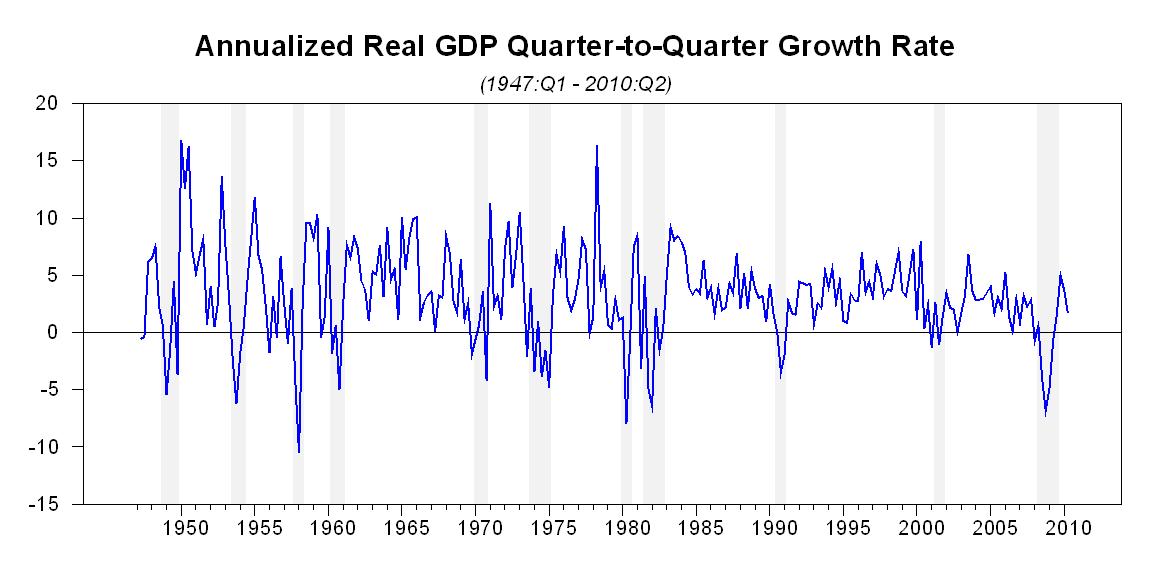
recession is shown in the graph below.
Measured
on a quarterly basis, data on GDP are prepared by the U.S. Department of Commerce's Bureau of Economic Analysis (BEA). As explained
in this
BEA release, a sequence of three values for any particular quarter is
released over time: the ‘advance estimate’ (at the end of the first
month following the end of the quarter), ‘second estimate’ (one
month after the release of the ‘advance’ data), and ‘third
estimate’ (two months after the release of the ‘advance’
data) values; prior to the July
2009 BEA NIPA 'comprehensive revision,' these were called the
‘advance,’ ‘preliminary,’ and ‘final’
estimates. Starting with the first quarter of 2009, I will provide
1-quarter-ahead forecasts of this key business cycle indicator. Some details on
how the forecasts were produced appear here.
1-Quarter-Ahead Forecasts for (Seasonally Adjusted) Real
GDP:
[Annualized
Percent Change from Previous Quarter]
|
Quarter |
Release Date of Advance Data |
Forecast |
Advance Estimate |
Second Estimate |
Third Estimate |
Annual Revision |
|
2010:Q4 |
January 28, 2011 |
2.6 |
|
|||
|
2010:Q3 |
October 29, 2010 |
1.8 |
2.014 |
2.515 |
2.616 |
|
|
2010:Q2 |
July 30, 2010 |
3.2 |
2.411 |
1.612 |
1.713 |
|
|
2010:Q1 |
April 30, 2010 |
3.7 |
3.28 |
3.09 |
2.710 |
3.7 |
|
2009:Q4 |
January 29, 2010 |
4.2 |
5.75 |
5.96 |
5.67 |
5.0 |
|
2009:Q3 |
October 29, 2009 |
2.0 |
3.52 |
2.83 |
2.24 |
1.6 |
|
2009:Q2 |
July 31, 2009 |
-1.2 |
-1.0 |
-1.0 |
-0.7 |
-0.7 |
|
2009:Q1 |
April 29, 2009 |
-5.3 |
-6.1 |
-5.7 |
-5.51 |
-4.9 |
|
2008:Q4 |
January 1, 2009 |
-- |
-3.8 |
-6.2 |
-6.3 |
-6.8 |
Last updated: January 3, 2011. Link to: BCI Forecast Page.