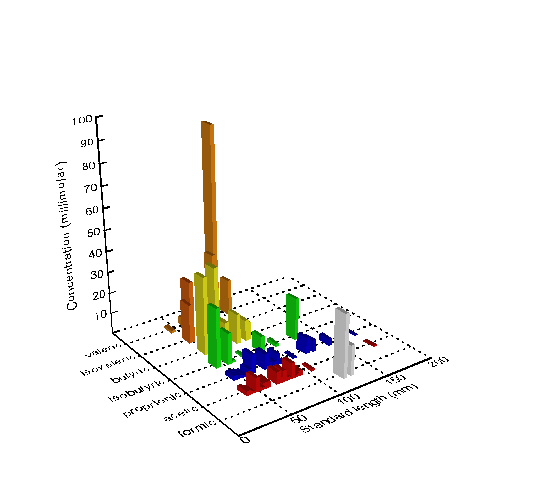
 Figure 1. A graph of volatile fatty acids (formic, acetic, proprionic,
isobutyric, butyric, isovaleric, and valeric) concentrations (millimolar)
plotted versus pinfish standard length (mm) between 40 and 160 mm SL.
Acetic and proprionic acids are produced by all sizes of fish, whereas
valeric was produced by small fish (< 100 mm SL) only. Because small
pinfish consume mostly animals, and valeric acid is made from protein,
these data suggest that diet can influence the intestinal bacteria and
their VFA production.
Figure 1. A graph of volatile fatty acids (formic, acetic, proprionic,
isobutyric, butyric, isovaleric, and valeric) concentrations (millimolar)
plotted versus pinfish standard length (mm) between 40 and 160 mm SL.
Acetic and proprionic acids are produced by all sizes of fish, whereas
valeric was produced by small fish (< 100 mm SL) only. Because small
pinfish consume mostly animals, and valeric acid is made from protein,
these data suggest that diet can influence the intestinal bacteria and
their VFA production.
Table 1. The Pearson correlation coefficient (r) between VFA
concentration (millimolar) and pinfish SL (mm). Formic and isovaleric acid
have been omitted from these correlations, because the sample size n was
too small for these VFAs.
| VFA |
Pearson correlation coefficient |
n |
| Acetic |
-0.012 |
39 |
| Proprionic |
0.108 |
23 |
| Butyric |
-0.722 |
7 |
| Isobutyric |
-0.038 |
9 |
| Valeric |
0.390 |
8 |